Overview
An understanding of harmonics is important in many areas of engineering, especially circuit design and test. It's important to understand that an approximate square wave (e.g., clock) is constructed through the process of adding a fundamental wave with many of its scaled, odd harmonics.
Oscilloscope vendors all have their own recommendations for the required scope bandwidth for a particular frequency of interest. We typically use the rule of 5 times. For example, a 625 MHz clock requires a scope bandwidth of over 3GHz. In other words, a 4GHz bandwidth scope would allow us to see the 3rd harmonic (1.875 Ghz) and 5th harmonic (3.125 GHz) of a 625 MHz clock (fundamental plus two odd harmonics).
This article summarizes and provides a simple Python script that can be used to model and visualize such waveforms. Both square and triangle waves can be easily visualized, and the code can be extended to create other waveforms through a customizable scaling function factor()
The generic harmonics equation modeled by the Python script is shown below using Math ML. Note that a square wave would only have odd harmonics.
y(t) =
We provide some examples below. Note that both Matplotlib and Numpy are required.
Examples
$ python3 harmonics.py -h
usage: harmonics.py [-h] [-f FREQUENCY] [-n HARMONICS] [-t TYPE] [-s SHAPE]

plot harmonics

optional arguments:
  -h, --help            show this help message and exit
  -f FREQUENCY, --frequency FREQUENCY
                        specify the frequency
  -n HARMONICS, --harmonics HARMONICS
                        specify the number of harmonics
  -t TYPE, --type TYPE  specify the type of harmonics (even, odd, or all)
  -s SHAPE, --shape SHAPE
                        specify the shaping factor (square, triangle)

Version: 0.2
Generate the fundamental (sine wave)
$ python3 harmonics.py
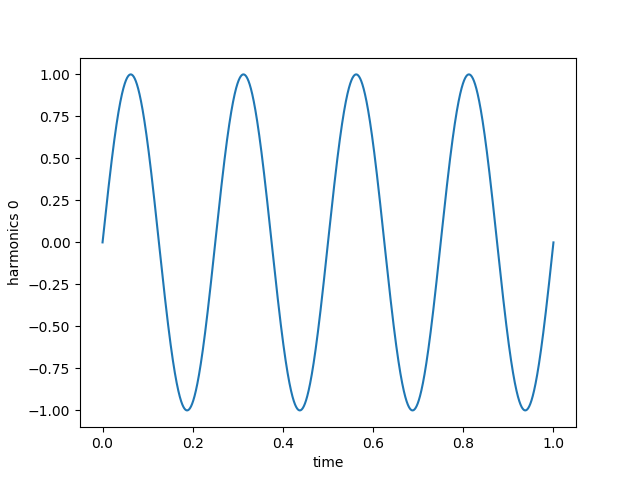
Generate the fundamental (sine wave) + 2 harmonics. We can see the square wave taking shape with large ripples.
$ python3 harmonics.py -n 2
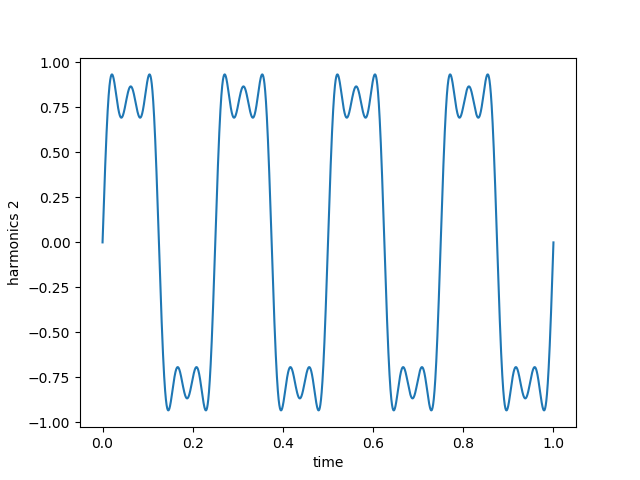
Let's crank up the harmonics to see that we begin to approximate an ideal square wave.
$ python3 harmonics.py -n 1000
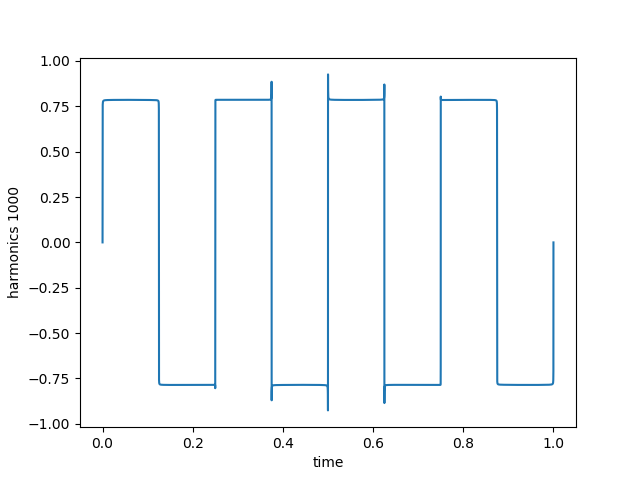
Generate a triangle wave. Note that the equation is now different due to a different scaling of the harmonics. See reference below.
$ python3 harmonics.py -n 1000 -s triangle
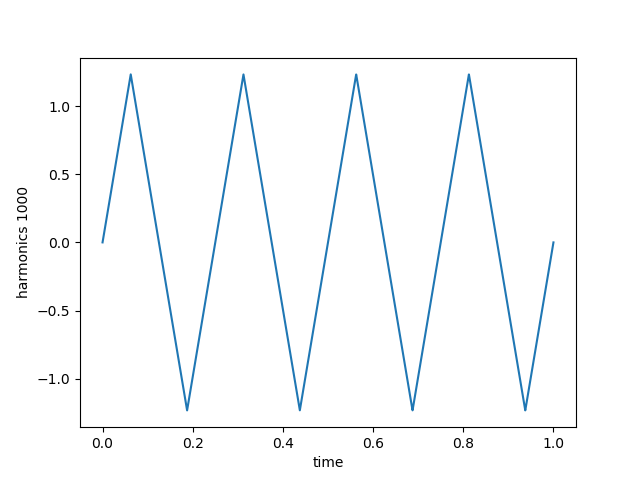
Harmonics Example using Oscilloscope
In the two figures below, we capture an oscilloscope screen shot by probing a ~10MHz clock signal generated by an FPGA on our Darsena card. We're using a passive probe that has an intrinisic bandwidth of 500 MHz to probe a standard 100 mil connector post.
The first figure shows a very clean, rounded clock using a 20 MHz bandwidth limited filter in our scope's front end.
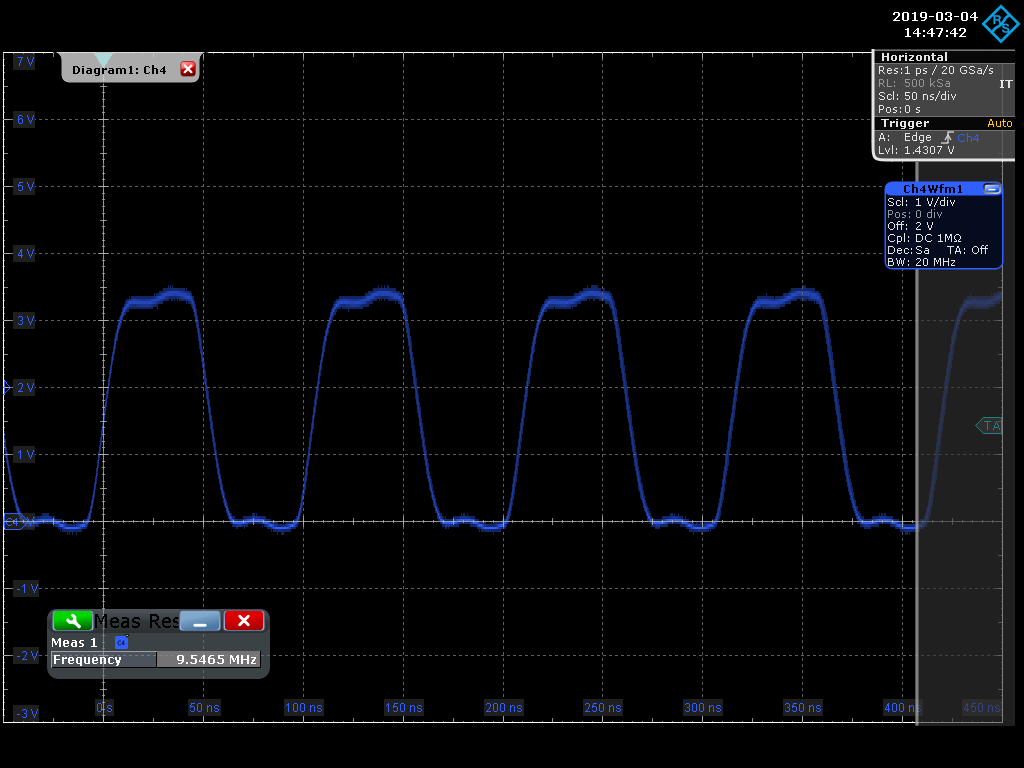
The next figure shows the exact same signal but this time using a 200MHz bandwidth filter. As you can see, we're now able to capture more harmonics and get a better look at the actual signal (plus noise due to our passive probe).
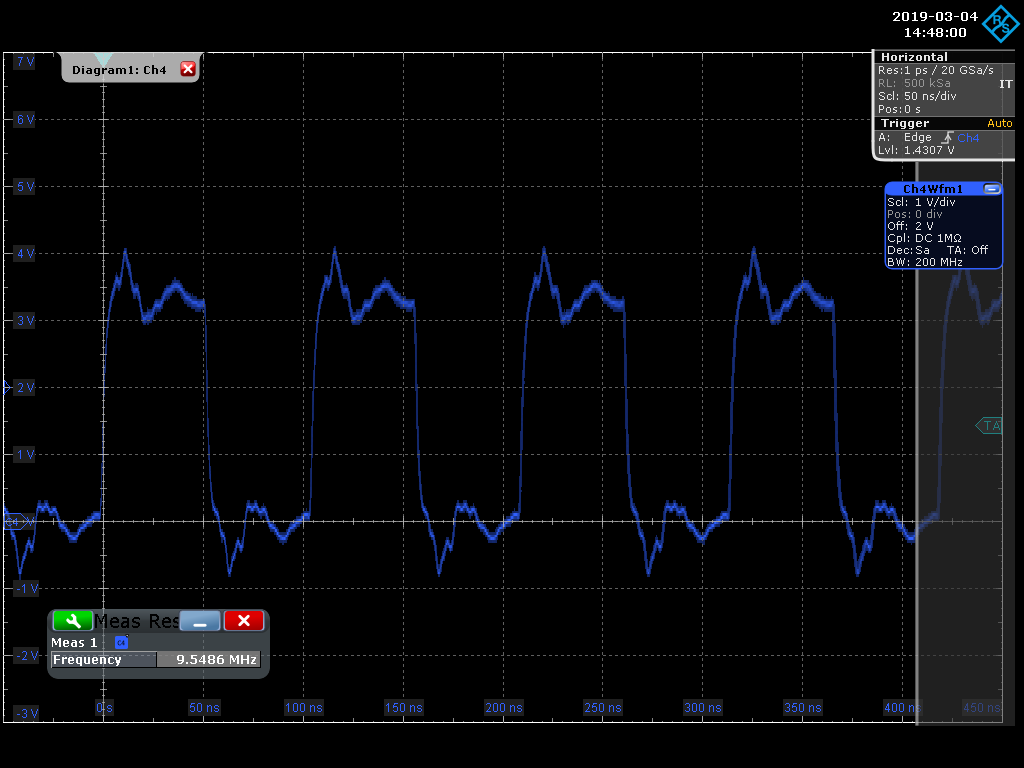
Two points to consider here are that adequate bandwidth in a scope can be absolutely critical in debugging a circuit. In the extreme case, limited bandwidth may mask seeing a glitch on the circuit board. Also keep in mind that the amplitude of the harmonics roll off quickly (e.g., 1/h), so it's typically not critical to see higher order harmonics.
Source
The Python script harmonics.py is provided below. Note the disclaimer in the header of the file.
##############################################################################
#
# Copyright (c) 2019, 2020 Mind Chasers Inc.
# All Rights Reserved.
#
#    file: harmonics.py
#
#    create and visualize harmonic waveforms
#
# THIS SOFTWARE IS PROVIDED "AS IS" AND ANY AND ALL EXPRESS OR IMPLIED
# WARRANTIES ARE DISCLAIMED, INCLUDING, BUT NOT LIMITED TO, THE IMPLIED
# WARRANTIES OF TITLE, MERCHANTABILITY, AGAINST INFRINGEMENT, AND FITNESS
# FOR A PARTICULAR PURPOSE.
#
##############################################################################

import matplotlib.pylab as plt
import numpy as np
import argparse

VERSION = '0.2'

def factor(shape, k, i):
    if shape == "triangle":
        return (1/(k*k) * (-1)**i)
    else:
        return (1/k)

if __name__ == '__main__':

    parser = argparse.ArgumentParser(description='plot harmonics',
                                 epilog='Version: ' + VERSION)
    parser.add_argument('-f','--frequency',default=4,type=int, help='specify the frequency',action='store')
    parser.add_argument('-n','--harmonics',default=0,type=int, help='specify the number of harmonics',action='store')
    parser.add_argument('-t','--type',default='odd',type=str, help='specify the type of harmonics (even, odd, or all)',action='store')
    parser.add_argument('-s','--shape',default='square',type=str, help='specify the shaping factor (square, triangle)',action='store')

    args = parser.parse_args()

    f = args.frequency

    if args.type == 'even':
        odd = 0
        mult = 2
    elif args.type == 'odd':
        odd = 1
        mult = 2
    else:   # all
        odd = 0
        mult = 1

    t = np.linspace(0, 1, num=8000)
    y = np.zeros(8000)

    # compute and add fundamental with each harmonic
    for i in range(int(args.harmonics)+1):
        k = i * mult + odd
        yh = factor(args.shape,k,i) * np.sin(2 * np.pi * k *  f * t)
        y = y + yh

    plt.plot(t, y)
    plt.xlabel('time')
    plt.ylabel('harmonics {0}'.format(args.harmonics))
    plt.axis('tight')
    plt.show()
    print('finished')
References
- Wikipedia: Triangle Wave
- More about NumPy and Matplotlib atSciPy.org


Date: Oct. 17, 2019
Author: Mat
Comment: