This article provides a basic foundational script (below) to interact with an oscilloscope over Ethernet using Python, VISA, and PyVISA. The system configuration is provided in the list below:
- Rohde & Schwarz RTO1044, 4 GHz scope
- Bench-top frequency generator (any signal source will do)
- Windows 10 PC with Gigabit Ethernet interfacing to RTO1044 via
a GigE switch and installed with:
- Tektronix VISA including the VISA Resource Manager
- Python3 installed from Python.org. Note that Anaconda is also a good choice on Windows 10.
- PyVISA 1.9 installed using pip
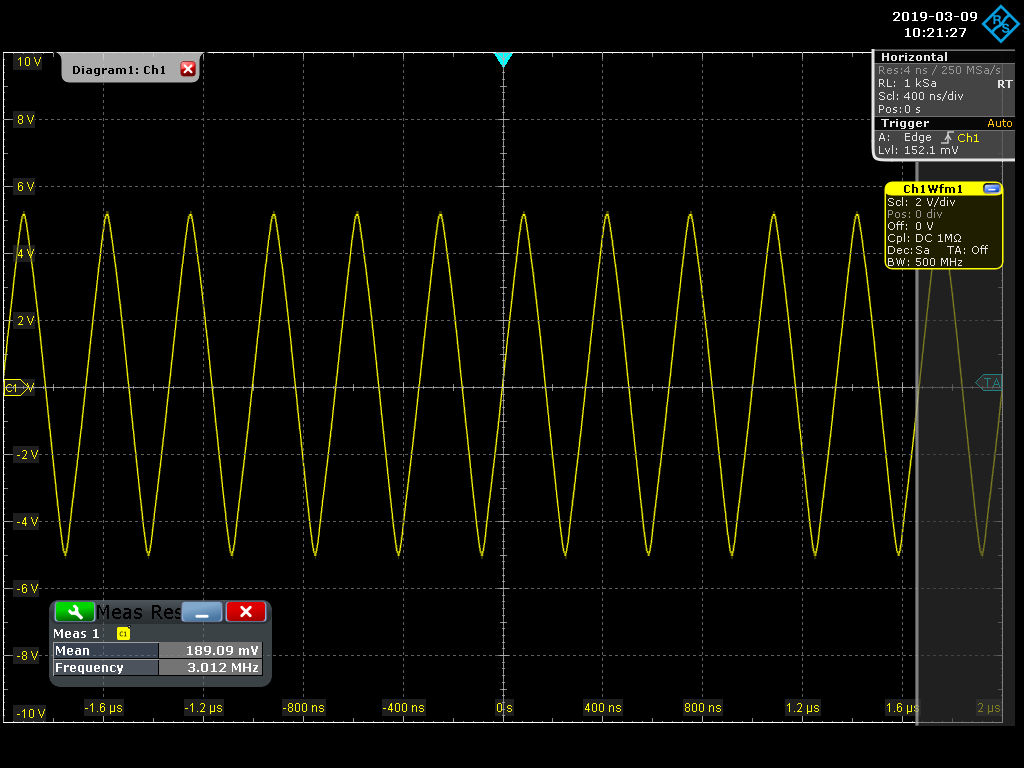
The figure below shows a screen shot of our RTO1044 capturing a sawtooth waveform on channel 1. The following parameters can be observed:
- Measured frequency: ~ 3.0 MHz
- Record Length: 1 KSa (1,000 samples)
- Sampling Frequency: 250 MSa/s
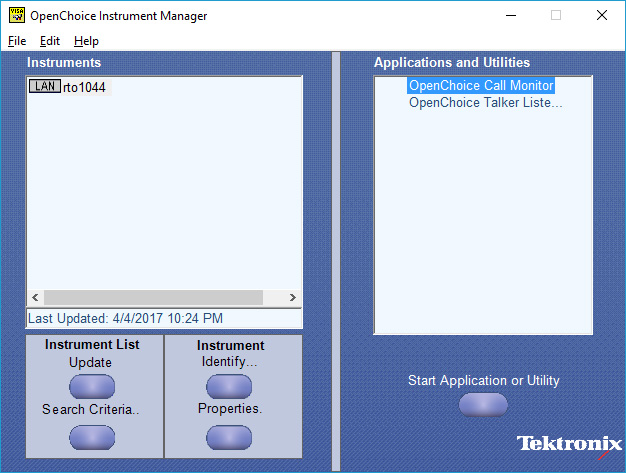
Although Rohde and Schwarz provides their own version of VISA, we use TEK's VISA with good results for both TEK and non TEK equipment. The figure below shows the TEK resource / instrument manager dialog box. The "rto1044" "string was assigned in the properties box. Our testing shows that we need to first bring up the resource manager before interacting with our scope remotely.
The source for our python script "rto_basic.py" is provided at the bottom of this article. Invoking the script with the "-h" argument returns the following:
> python .\rto_basic.py -h
usage: rto_basic.py [-h] [-b] [-c {1,2,3,4}] [-n NAME] [-t] [-p] [-f]
                    [-s SAMPLING]

RTO remote waveform demo utility

optional arguments:
  -h, --help            show this help message and exit
  -b, --binary          save binary file of floats as a pickle
  -c {1,2,3,4}, --channel {1,2,3,4}
                        scope channel to use
  -n NAME, --name NAME  filename
  -t, --text            save text file of floats
  -p, --plot            plot captured waveform
  -f, --plotfft         plot captured waveform as FFT
  -s SAMPLING, --sampling SAMPLING
                        sampling frequency, default is 1 M

Version: 0.2
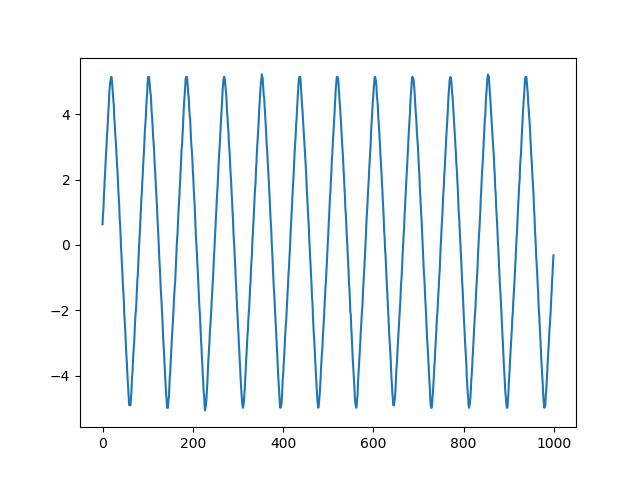
To plot a waveform:
> python .\rto_basic.py -p -c 1 # plot channel 1
To plot an FFT:
> python .\rto_basic.py -f -c 1
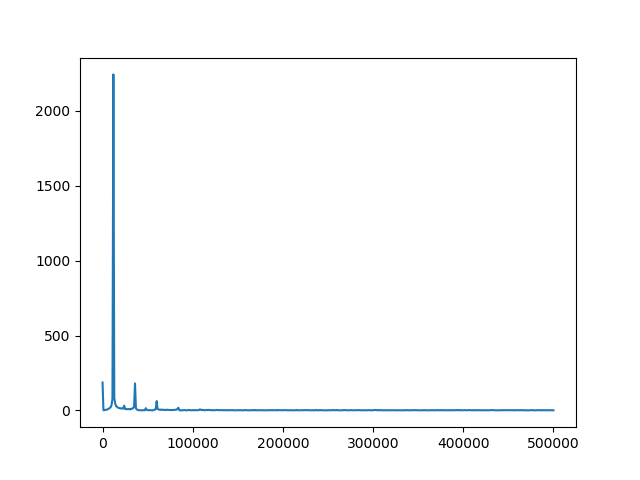
The provided script also supports saving the captured waveform as either a text or binary file. In the latter case, the file is a python pickle, which makes life very easy storing and retrieving data (as shown below):
> python
Python 3.7.1 (v3.7.1:260ec2c36a, Oct 20 2018, 14:05:16)
>>> import pickle
>>> f=open('signal.pickle','rb')
>>> values=pickle.load(f)
>>> len(values)
1000
>>> values[0:5]
[0.6324110627174377, 0.8695651888847351, 1.1067193746566772, 1.4229248762130737, 1.7391303777694702]
>>>
##############################################################################
#
# Copyright (c) 2017, 2018, 2019 Mind Chasers Inc.
#
#    file: rto_basic.py
#
#    basic / demo waveform capture utility
#
# THIS SOFTWARE IS PROVIDED "AS IS" AND ANY AND ALL EXPRESS OR IMPLIED
# WARRANTIES ARE DISCLAIMED, INCLUDING, BUT NOT LIMITED TO, THE IMPLIED
# WARRANTIES OF TITLE, MERCHANTABILITY, AGAINST INFRINGEMENT, AND FITNESS
# FOR A PARTICULAR PURPOSE.
#
##############################################################################

import sys
import visa
import pickle
import argparse
import numpy as np
import matplotlib.pyplot as plt

VERSION = 0.2


if __name__ == '__main__':
    parser = argparse.ArgumentParser(description='RTO remote waveform demo utility',
                                 epilog='Version: ' + str(VERSION))
    parser.add_argument('-b','--binary',help='save binary file of floats as a pickle',action='store_true')
    parser.add_argument('-c','--channel',help='scope channel to use',action='store', default='1', type=int, choices=range(1, 5))
    parser.add_argument('-n','--name',help='filename', action='store', default='signal')
    parser.add_argument('-t','--text',help='save text file of floats',action='store_true')
    parser.add_argument('-p','--plot',help='plot captured waveform',action='store_true')
    parser.add_argument('-f','--plotfft',help='plot captured waveform as FFT',action='store_true')
    parser.add_argument('-s','--sampling',help='sampling frequency, default is 1 M', action='store', default='1000000')


    args = parser.parse_args()
    ch = 'channel'+str(args.channel)

    try:
        rm = visa.ResourceManager()
        inst = rm.open_resource("rto1044")
        print(inst.query("*IDN?"))
    except Exception as e:
        print("Error creating instance: {0}".format(e))
        sys.exit()

    # grab the waveform
    try:
        inst.query(ch + ":data:header?")
        inst.write("format real,32")
        values=inst.query_binary_values(ch + ":data:values?", datatype='f')
    except Exception as e:
        print("Error retrieving the waveform: {0}".format(e))
        print("Did you specify the right channel?")
        sys.exit()

    # do something with the waveform
    if args.plot:
        plt.plot(values)
        plt.show()

    if args.text:
        fsig = open(args.name+".txt","w")
        for value in values:
            fsig.write("%s\n" % value)
        fsig.close()

    if args.binary:
        fsig = open(args.name+".pickle","wb")
        pickle.dump(values,fsig,pickle.HIGHEST_PROTOCOL)
        fsig.close()

    if args.plotfft:
        Fs = float(args.sampling)       # sampling frequency
        n=len(values)                   # number of samples
        Ts=1/Fs                         # sampling period
        s=np.fft.rfft(values)           # computer fft for real input.  s is the complex transform array
        fs=np.fft.rfftfreq(n,Ts)        # return the frequencies
        plt.plot(fs,np.absolute(s))
        plt.show()

    inst.close()
    print("finished")
References
- Tektronix What is VISA?
- PyVISA
- More about NumPy and Matplotlib at SciPy.org

